Case study
VisualizationTableauPower BISQL
Customer Segmentation Explorer
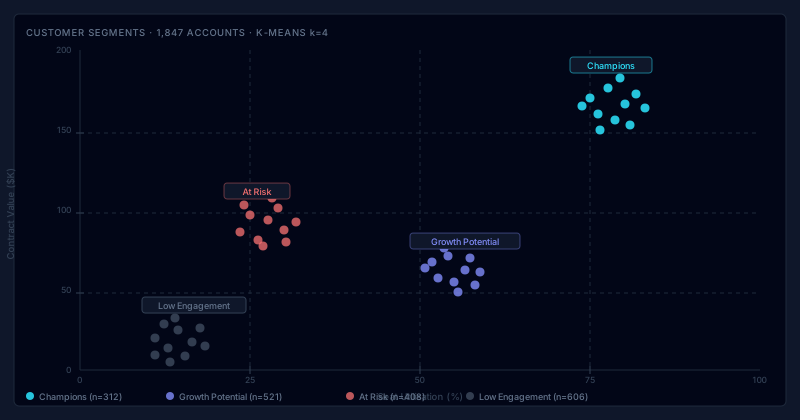
Interactive Tableau workbook that clusters customers by behaviour and value, letting the growth team explore segments and export target lists without waiting on an analyst.
Case study
Variation 1/3
Question
What's the fastest way to let anyone explore customer segmentation explorer for themselves?
Approach
Using Tableau, Power BI, and SQL, the data was transformed into a visual narrative — interactive Tableau workbook that clusters customers by behaviour and value, letting the growth team explore segments and export…
Result
The finished visualization is live and explorable at the link below.
Hover a row to edit · changes save to your portfolio